Sign Up And Receive Our Latest Promotions!
Why half your retina trial patients fail screening, and what to do about it
Retina trials have a screen failure rate of 52%1. Nearly half of those failures are entirely predictable from a single data source the site already has: the retinal image. Here is what that costs and how to fix it.
Every retina clinical trial begins the same way: with a labor-intensive process. It starts with sites manually filtering lists and electronic medical records (EMR) notes, followed by weeks of outreach just to book a single patient for an exhaustive 4 to 6-hour screening visit.
After a battery of tests and a multi-day wait for reading center results, the outcome is discouraging: the majority of these patients are disqualified.
Unfortunately, this isn’t an edge case but the norm. And it’s one of the most expensive inefficiencies in drug development. It is also a heartbreaking reality for many patients, who, after enduring a battery of tests in the hope of accessing a new treatment, are told they don’t qualify. Why? Mostly due to a single imaging detail.
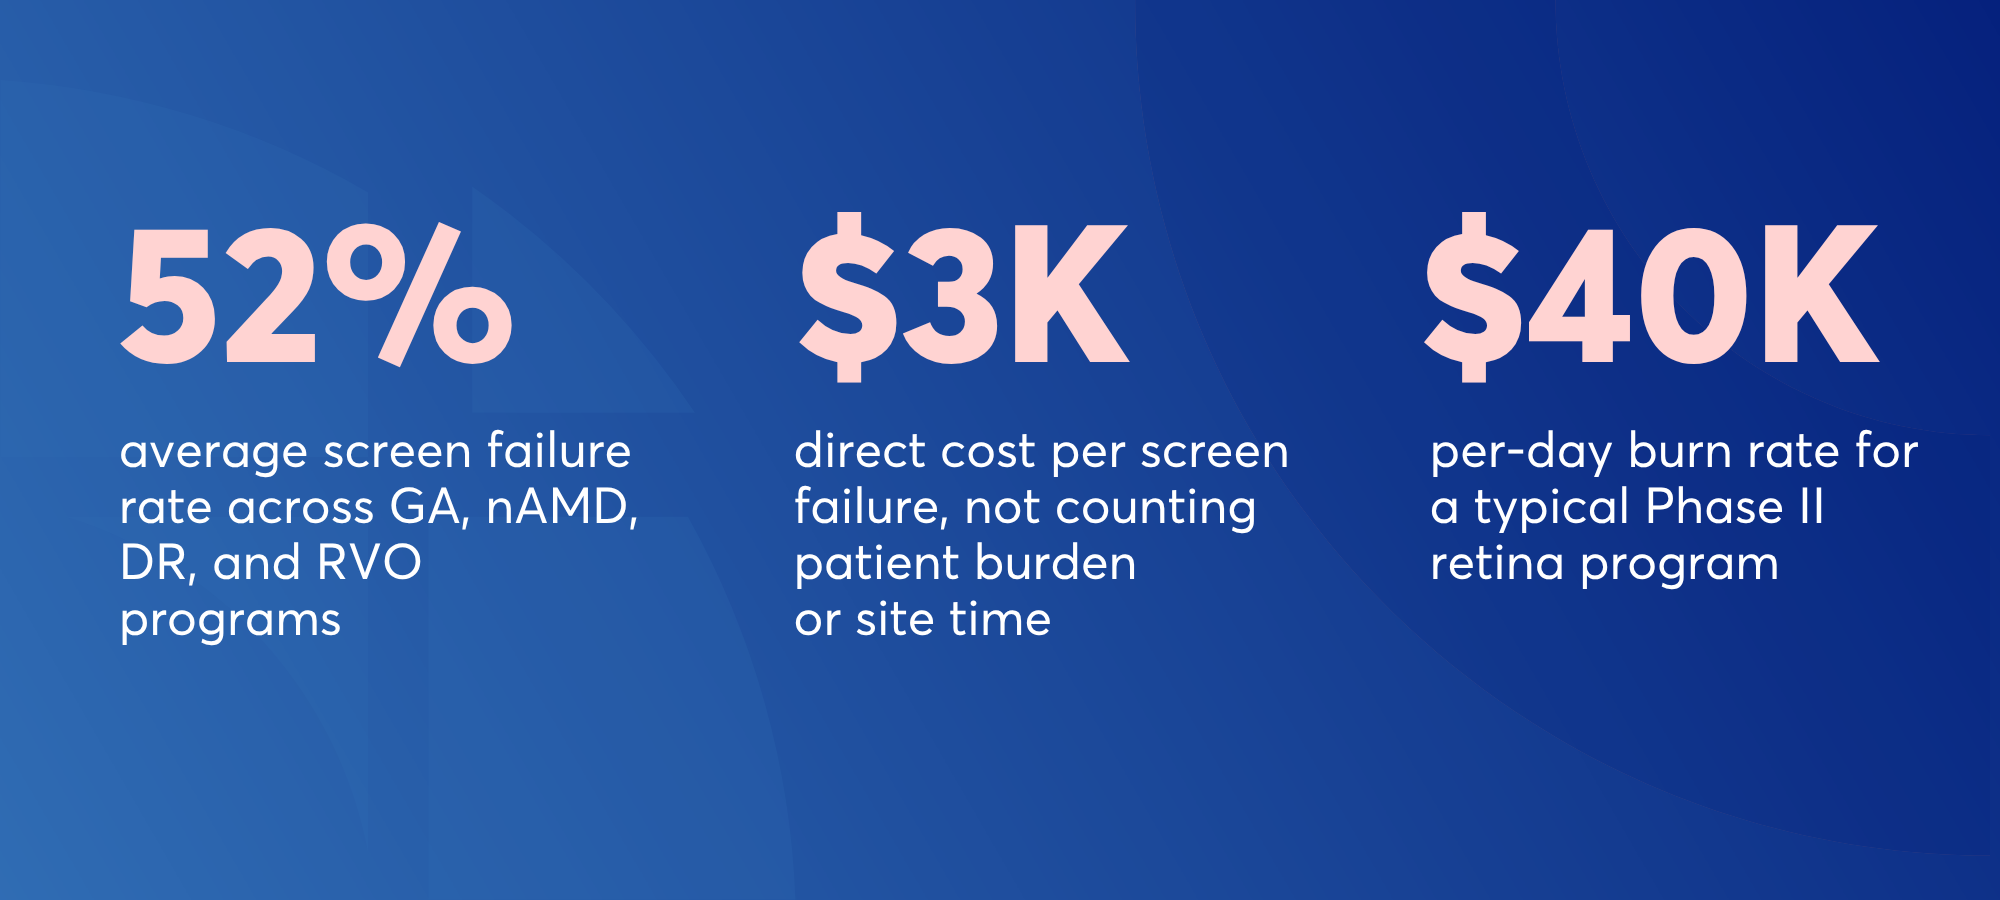
A program operating at 37.5% screen failure rate that moves to 30% screen failures compresses enrollment by roughly 3.4 months, which translates to approximately $3 million in direct savings and up to $60 million in recovered opportunity cost from earlier market entry2.
The math is undeniable, yet these savings remain out of reach for most sponsors. So, where is the disconnect?
The image a site already has is the one to blame
Here is the part that makes this problem interesting, and solvable: 44% of retina screen failures are driven by imaging criteria alone1. In GA it can be even higher: lesions that are the wrong size; foveal involvement where the protocol excluded it; intraretinal or subretinal fluid that rules a patient out immediately1,2,3.
These are not hidden or ambiguous findings. They are visible in the patient’s most recent OCT scans, images that already exist in the clinic’s imaging system from routine care visits. The patient doesn’t always need a special screening appointment for the site to know they won’t qualify. The battery of tests is done to have more data, but if they don’t qualify initially, that’s a waste of time and resources both for the patient and the site. The information is already there, so why not tap into it?
The problem isn’t missing data; it’s that the existing imaging data is not effectively leveraged before scheduling a screening visit that is doomed to fail. In many cases, it’s simply because the difference between enrollment and disqualification is a measurement too minute or too time-consuming for a manual review to catch. When a CST of 320 μm or more is a “go” and 315 μm is a screen failure, it’s humanly impossible to catch.
Beyond the direct cost, there is a patient burden that doesn’t appear on any budget line. A population that is, by definition for age-related retinal diseases, elderly and visually impaired, is travelling to a clinical site a good distance away from home, waiting for hours, and then being told they don’t qualify.
That experience is negative; it can erode trust for patients, they feel hopeless, and it's demotivating for sponsors and sites alike. and on the sponsor and site side too. The downstream effect is slower enrollment for the next program too.
The solution? AI-based imaging review to drive efficient EMR review, then invite
The traditional screening workflow is sequential:
.png)
The imaging-first approach flips it as it filters the patient population against the protocol’s imaging and clinical criteria BEFORE any patient walks through the door, and then invites ONLY those who are likely to qualify.
The practical result?
Sites go from screening a broad speculative pool to screening a selected pre-filtered one.
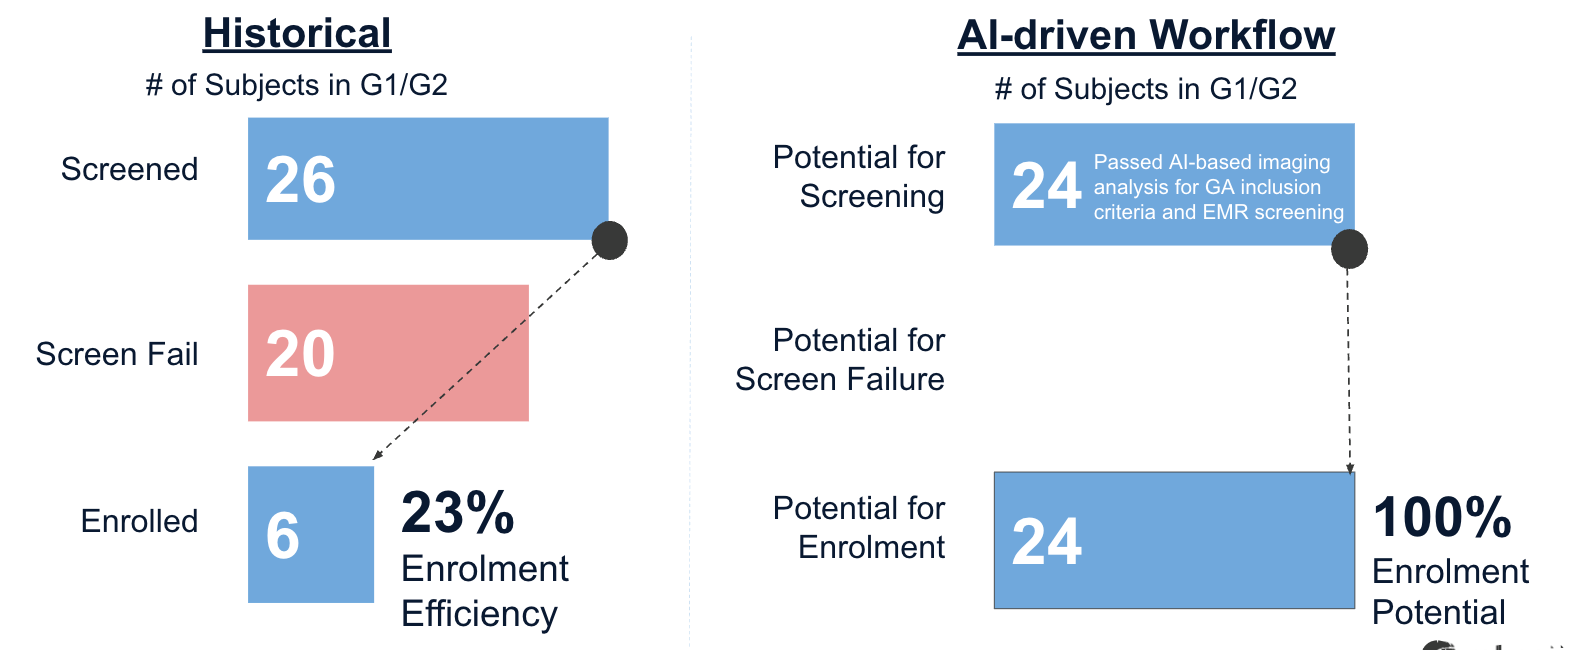
EMR review becomes confirmatory rather than exploratory. A site that used to screen 26 patients to enroll six (23% enrollment efficiency), now with an automated-driven workflow pre-filters data to 24 patients to potentially enroll 24 (100% enrollment efficiency).
This is not simply an application of Artificial Intelligence (AI). It’s a methodology that integrates four distinct capabilities working in sequence.
The RetinAI’s five-step methodology
1. Automated imaging aggregation and anonymization
When data - past and present - is centralized in a secured platform, candidate identification and trials in general are by essence faster and simpler.
Discovery CONNECT pulls data (images from imaging devices or databases) on a configurable cadence, ensuring de-identification of patient data before upload to the cloud.
This is done in less than 30 seconds per image. No manual steps are required.
It works seamlessly across Heidelberg, Topcon and Zeiss OCT devices, as well as DICOM-compliant images.
This ensures every site, no matter its setup, can automatically sync data into one single platform.
DICOM metadata is scrubbed to HIPAA and GDPR standards. Critically, the unique de-identified patient ID that links an image to the site’s EMR is preserved in a local, site-only mapping so the site retains sole control of re-identification at every step.
By centralizing historical imaging, CONNECT makes it easier to evaluate site feasibility and patient profiles with the help of AI, ensuring trials are matched with the right sites from the start.
2. Protocol translated to quantifiable biomarkers
A protocol’s inclusion and exclusion criteria are written and matched to AI-based imaging criteria. For example, a non-foveal RPE atrophic lesion within a predetermined range (e.g., 2.5-17 mm2), drusen diameter of more than 1.5 μm, central subfield thickness of more than 300 μm, SRF and IRF volume within certain limits, presence of epiretinal membranes, just to mention a few.
When the protocol is matched to anatomical definitions our AI models measure on each image, it becomes a way to pre-screen images, faster and consistently.
At RetinAI, our AI models can detect, segment and quantify a library of biomarkers that evaluate most of the major retinal indications. From retinal layers to choroid thickness, fluid volume, loss of layer thickness and atrophic area, average volumetric measurements per ETDRS-grid segment, and distance of lesions from foveal center measurements are computed instantly and again, consistently
The output of this step is a protocol-specific configuration for AI that drives the rest of the workflow.
See if your protocol maps to our biomarker library
We recommend a protocol-to-biomarker workshop as the first step. Bring the inclusion and exclusion criteria of your upcoming trial, whether you are targeting CST thresholds, specific fluid volumes, atrophic areas, or precise layer thicknesses.
Our team will walk you through exactly how those criteria map to the Discovery biomarker library to create your protocol-specific AI configuration. No procurement required, no commitment - just a conversation to see how our AI models can automate your pre-screening workflow.
3. Site-level filtering at image-library scale
Once the inclusion/exclusion criteria are translated into filterable AI-driven and imaging-based criteria, it's all set to query your database with our AI models.
The resulting biomarkers and corresponding measurements are exported and ready for filtering.
First, we apply basic image quality filters, such as minimum scan area and B-scan count for OCTs, to obtain a cleaner dataset.
Then, we filter the database based on your specific protocol-tailored imaging criteria, which are usually a combination of complex parameters. For example, a comprehensive assessment of fluid volume dynamics may require aggregating measurements across all available scans throughout a patient’s treatment history. Eligibility may involve assessing inclusion/exclusion criteria across both study and fellow eyes, and filtering measurements in cases of multi-focal atrophic lesions can all be readily handled in this setup
Querying your database on very specific imaging inclusion and exclusion criteria is a thorough process and provides you the list of all potential eligible candidates. Biomarker combinations can be fully customizable, so you can target the exact patient profile required.
Clinical exclusion criteria that require the EMR review, such as treatment history, ocular and systemic comorbidities, medication records, among others, are intentionally deferred to the next step. With this approach, EMR review becomes efficient and targeted.
4. Secure EMR reconciliation
Once the imaging-filtered shortlist is retrieved, the site’s trial coordinator can then run the list against the EMR to apply clinical inclusion/exclusion criteria.
In this list, shortlisted patients are not just randomly organised; they are deliberately ordered based on a priority scoring customized for each particular study. For example, prioritization can include time since the last visit and additional parameters related to the inclusion and exclusion criteria (e.g., biomarker values closer to the middle of their specified ranges, reducing the risk of exclusion due to progression since the last visit).
The candidate list delivered to sites also includes the summary measurements for each candidate in case sites would like to apply their own filtering or sorting for review.
5. RetinAI going the extra step: secure & compliant EMR review
For sites that allow it, RetinAI can connect securely and compliantly to a site’s EMR to review the imaging-filtered list against the clinical inclusion and exclusion criteria.
With this service, a site receives an end-to-end filtered pre-screening candidate list, and can begin calling patients for screening.
A proven Use Case
These five capabilities are part of RetinAI’s Candidate Identification Service.
GATHER 1 / GATHER 2 Retrospective Analysis for better Candidate Identification in GA trials
Dr. Eichenbaum’s team ran a retrospective study analysis, comparing actual historical enrollment in GATHER 1 and GATHER 2 Geographic Atrophy trials against what RetinAI Discovery would have delivered if deployed at the time.
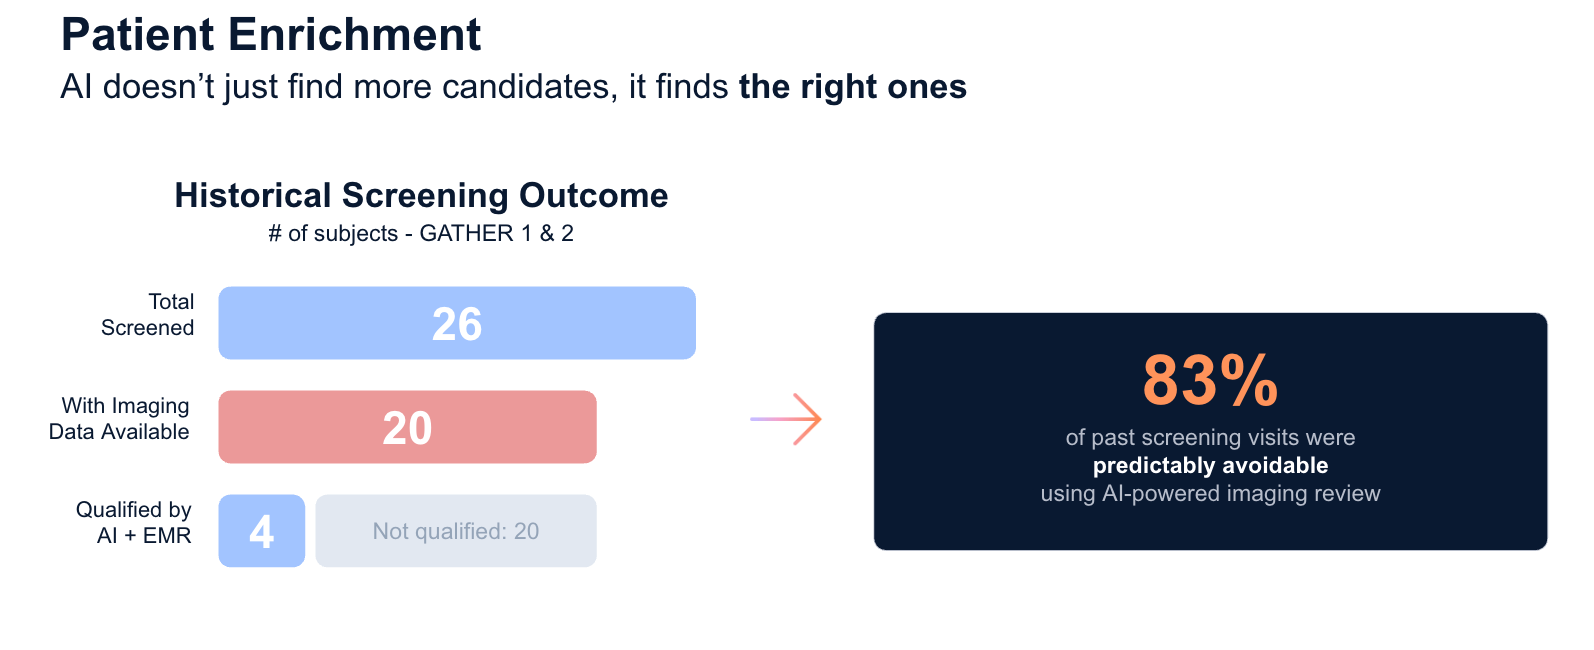
Manually identified, the site screened 26 patients, experienced 20 screen failures, 90% of these screen-failures driven by imaging criteria, and finally enrolled 6 patients between both trials. Enrollment efficiency: 23% over approximately 18-month enrollment timeframe for both trials.
In the retrospective analysis, RetinAI Discovery analyzed 72,141 OCT cubes from 10,421 subjects from a Dr. Eichenbaum's site. It filtered ~90% on imaging alone (no qualifying GA lesion or fluid present), and a further 8% for central foveal involvement or wrong lesion location. After EMR reconciliation, the pipeline surfaced 24 high-confidence theoretical candidates. All this achieved >4x faster than the historical enrollment timeframe.
6 patients enrolled via traditional screening workflow (23% efficiency) versus 24 high confidence candidates via RetinAI’s AI-driven workflow retrospectively analyzed.
From the 24 historical screening with imaging available, 20 resulted in screen failures, with 83% of these screen failures not meeting the imaging criteria after the reading centre reviewed the images. This means 83% of screen failures were imaging-driven and could have been detected in advance!
What comes next
Candidate Identification is the first problem this methodology is built to support. Today’s reading center model puts a patient’s eligibility decision on hold for hours, or sometimes days, while images are sent to reading center for review.
The near-term evolution is an in-clinic AI read that gives the site a structural eligibility assessment - fluid volume, central subfield thickness, GA lesion area, while the patient is still in the chair.
And this is already possible with RetinAI Discovery.
The site, sponsor, reading center, graders all have access to the same Discovery platform and are notified when a new patient comes in and is ready to be reviewed.
See if the methodology fits your program
We recommend a protocol-to-biomarker workshop as the first step. Bring the inclusion and exclusion criteria from a trial you’re actively planning: our team will walk you through how those criteria map to the Discovery biomarker library. No procurement required, no commitment, a conversation about whether this is the right fit for your trial.
References
1 Hasan N, Mehrotra K, Danzig CJ, Eichenbaum DA, Ewald A, Regillo C, Momenaei B, Sheth VS, Lally DR, Chhablani J. Screen Failures in Clinical Trials in Retina. Ophthalmol Retina. 2024 Nov;8(11):1093-1099. doi: 10.1016/j.oret.2024.05.014. Epub 2024 May 27. PMID: 38810882.
2Tufts CSDD | White Paper | Quantifying the Value of a Day of Delay in Drug Development; 2024
2 Biarnés M, Garrell-Salat X, Gómez-Benlloch A, et al. Methodological Appraisal of Phase 3 Clinical Trials in Geographic Atrophy. Biomedicines. 2023;11(6):1548. Published 2023 May 26. doi:10.3390/biomedicines11061548
3 C. K. Brinkmann, S. Schmitz-Valckenberg, M. Fleckenstein, N. Stratmann, F. Alten, G. J. Jaffe, T. C. Hohman, F. G. Holz, GATE Study Group; Screening for Patient Eligibility Using Fundus Autofluorescence in a Randomized Interventional Clinical Trial for Geographic Atrophy Secondary to Age-Related Macular Degeneration. Invest. Ophthalmol. Vis. Sci. 2010;51(13):105.
Ikerian AG (HQ)
Freiburgstrasse 3
3010 Bern
Switzerland
RetinAI US Inc. (US)
6 Liberty Square
#2498 Boston, MA 02109
United States
Imprint/Legal Notice | Data Processing Agreement | Privacy Notice | Created by Ikerian AG. All rights reserved 2016-2026 ©